
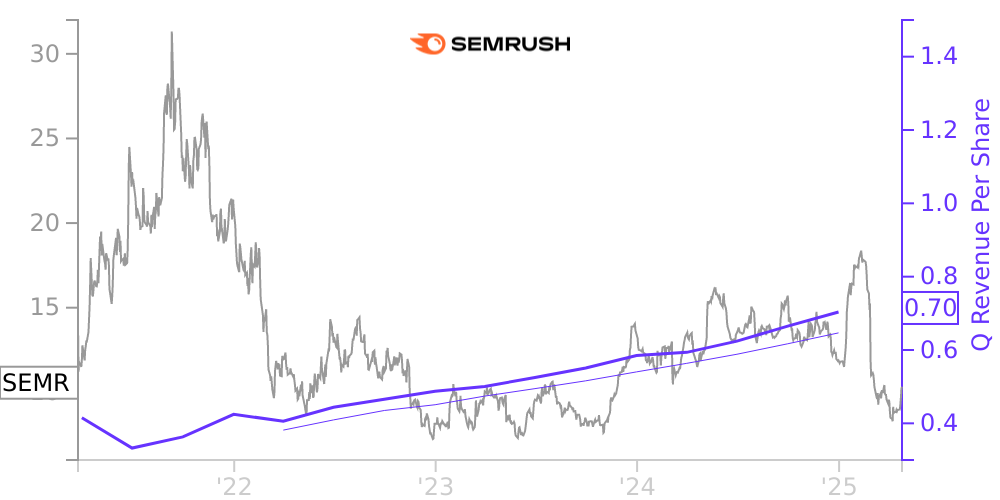
SEMR Stock Price Correlated With SEMrush Holdings Financials
External Links ⌄
Income Statement
Cash Flow
Balance Sheet
SEMR Income Statement
Enable JavaScript and reload
Revenue, Net:
Cost of Goods & Services Sold:
Gross Profit:
Selling, General & Admin Expense:
Research & Development Expense:
Total Operating Expenses:
Operating Income:
Income Taxes:
Net Income:
SEMR Cash Flow
Enable JavaScript and reload
Operating Activities Net Income:
Depreciation, Depletion & Amortization:
Change in Accounts Receiveable:
Net Cash from Operations:
Repurchases/Buybacks Common Stock:
Issuance of Long-term Debt:
Cash Dividends Paid:
Net Cash from Financing Activities:
Property, Plant & Equipment Purchases:
Purchases of Businesses, Net of Cash:
Net Cash from Investing Activities:
Net Change in Cash & Equivalents:
SEMR Balance Sheet
Enable JavaScript and reload
Cash and Cash Equivalents:
Short-Term Investments:
Accounts Receivable, Net:
Inventories:
Total Current Assets:
Property, Plant & Equipment, Net:
Total Assets:
Accounts Payable:
Current Portion of Long-Term Debt:
Total Short-Term Liabilities:
Long Term Debt, Non-Current Portion:
Total Long-Term Liabilities:
Total Liabilities:
COMPANY PROFILE
Overview and Basis of Presentation Description of Business
Semrush Holdings, Inc. (“Semrush Holdings”) and its subsidiaries (together the “Company”, or “Semrush”) provide an online visibility management software-as-a-service (“SaaS”) platform. The Company’s platform enables its subscribers to improve their online visibility and drive traffic, including on their websites and social media pages, and distribute highly relevant content to their customers on a targeted basis across various channels to drive high-quality traffic and measure the effectiveness of their digital marketing campaigns. The Company is headquartered in Boston, Massachusetts, and has wholly owned subsidiaries in Cyprus, Russia, the Czech Republic, Poland, Spain, and the United States.
The Company is subject to a number of risks and uncertainties common to companies in similar industries and stages of development that could affect future operations and financial performance. These risks include, but are not limited to, rapid technological change, competitive pressure from substitute products or larger companies, protection of proprietary technology, management of international activities, the need to obtain additional financing to support growth, and dependence on third parties and key individuals.
Public Offerings
On March 29, 2021, the Company closed its initial public offering (“IPO”) in which it sold 10,000,000 shares of its Class A common stock at a price to the public of $14.00 per share. The Company received $126.6 million in net proceeds after deducting approximately $13.4 million for underwriting discounts, commissions and offering expenses. Immediately prior to the completion of the IPO, all shares of common stock then outstanding were reclassified as Class B common stock, and all shares of redeemable convertible preferred stock and convertible preferred stock then outstanding were converted into shares of common stock on a one-to-one basis and then reclassified into Class B common stock.
On April 20, 2021, the underwriters of the Company’s IPO partially exercised their option to purchase additional shares of Class A common stock. In connection with the closing of the partial exercise on April 23, 2021, the underwriters purchased 719,266 shares of the Company’s Class A common stock for net proceeds to the Company of $9.2 million after deducting approximately $0.8 million for underwriting discounts, commissions, and offering expenses.
On November 23, 2021, the Company closed a follow-on offering (the “Follow-On Offering”) in which it sold 4,000,000 shares of its Class A common stock at a price to the public of $20.50 per share. The Company received $77.9 million in net proceeds after deducting approximately $4.1 million for underwriting discounts, commissions and offering expenses. Selling stockholders sold an aggregate of 1,000,000 shares of Class A common stock in the Follow-On Offering.
Effects of the Russian Military Action in Ukraine
Economic, civil, military, and political uncertainty exists and may increase in many of the regions where the Company operates and derives its revenue. Several countries in which the Company operates are experiencing and may continue to experience military action and civil and political unrest as a result of such action. The Company has significant development operations in the emerging market economies of
Eastern Europe and more than half of the Company’s full-time employees are located in Russia. The Company is beginning to relocate its Russia-based workforce. Please refer to Note 18 for further details.
In late February 2022, Russian military forces launched significant military action against Ukraine, and sustained conflict and disruption in the region is likely. The impact to Ukraine and Russia, as well as actions taken by other countries, including new and stricter sanctions by Canada, the United Kingdom, the European Union, the U.S. and other countries and organizations against officials, individual
Free historical financial statements for SEMrush Holdings Inc.. See how revenue, income, cash flow, and balance sheet financials have changed over 20 quarters since 2021. Compare with SEMR stock chart to see long term trends.
Data imported from SEMrush Holdings Inc. SEC filings. Check original filings before making any investment decision.